By Thad Austin-Niven, Property Lookout. Data to 30 September 2026.
If you're buying a home in Canberra, one of the first questions is usually "which suburbs have actually grown?" Ask around and you'll hear a lot of opinions. So I pulled the numbers instead.
I mapped house price growth for every Canberra suburb with enough sales to report reliably, over three time frames: 10 years, 5 years and the last 12 months. Some of the results back up what most people assume. A few of them don't.
Quick answer: which Canberra suburbs have grown the most?
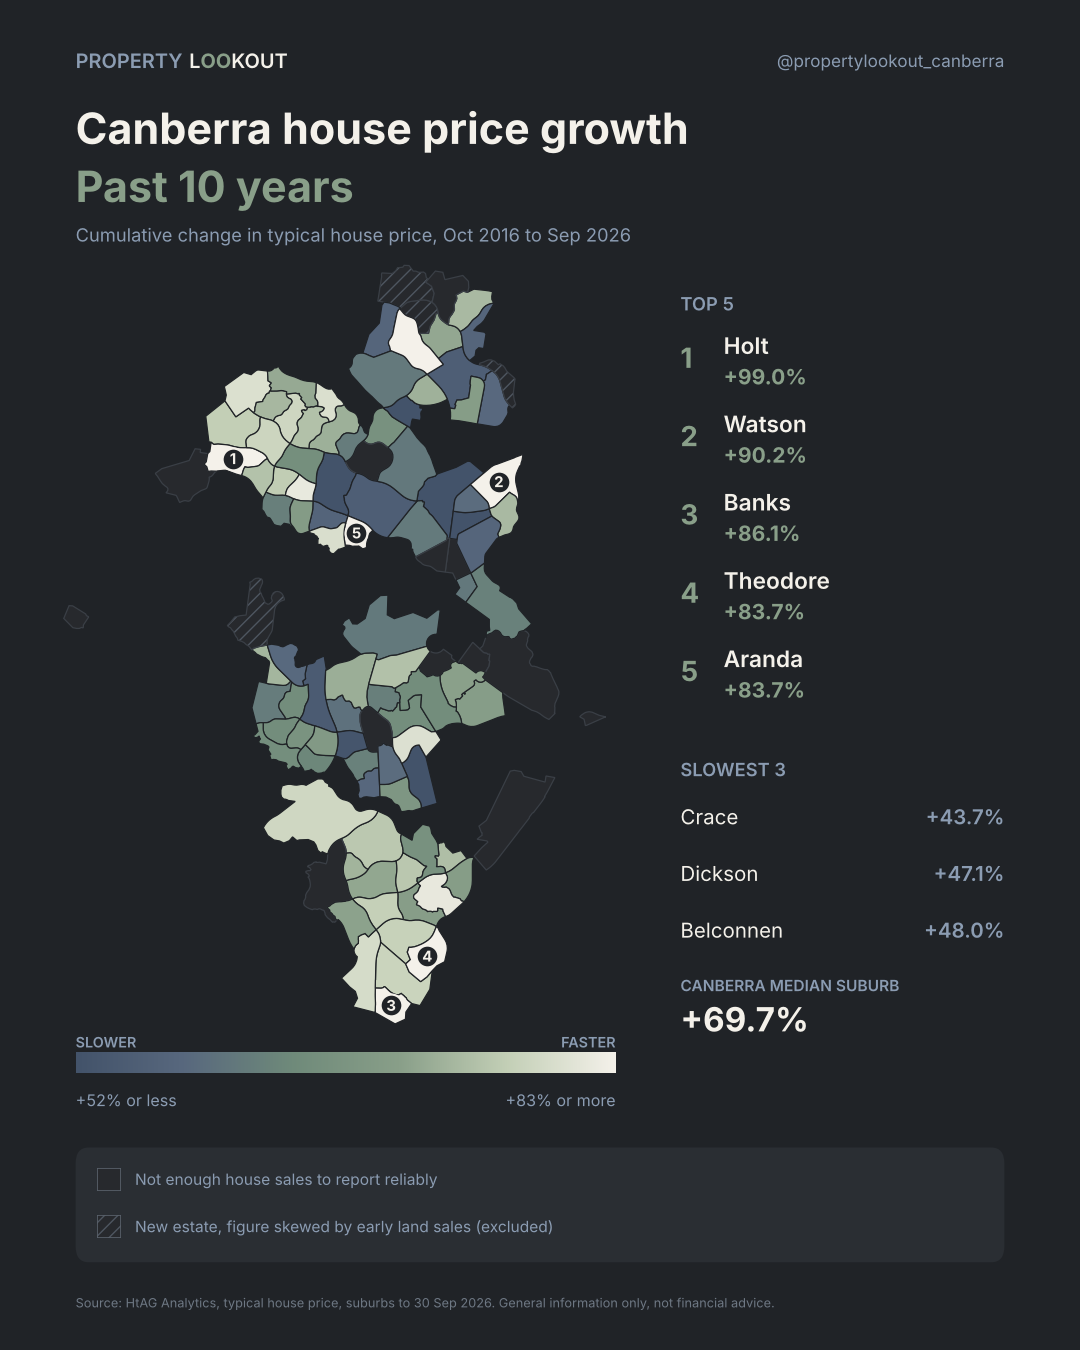
- Over 10 years: Holt (+99%), Watson (+90%) and Banks (+86%) lead Canberra for house price growth. The typical suburb grew about 70%.
- Over 5 years: Cook (+31%), Belconnen (+30%) and Aranda (+27%) are on top. The typical suburb grew about 14%.
- Over the last 12 months: Denman Prospect (+9.8%) leads, followed by Cook, Macarthur, Banks and Franklin at around +5%. The typical suburb grew 3.4%.
- The surprise: Tuggeranong has been one of Canberra's strongest districts, while Lyons and Chifley in Woden Valley, and Downer in the Inner North, have been close to flat for five years.
You can search any suburb yourself on the interactive Canberra suburb growth map.
Canberra suburbs with the highest capital growth over 10 years
Holt is Canberra's top performer over the past decade, with the typical house price up 99%. Put simply, a typical Holt house has almost doubled in value since 2016.
| Rank | Suburb | District | 10 year growth | Typical house price |
|---|---|---|---|---|
| 1 | Holt | Belconnen | +99.0% | $844,000 |
| 2 | Watson | Inner North | +90.2% | $1,272,000 |
| 3 | Banks | Tuggeranong | +86.1% | $948,000 |
| 4 | Theodore | Tuggeranong | +83.7% | $938,000 |
| 5 | Aranda | Belconnen | +83.7% | $1,561,000 |
| 6 | Ngunnawal | Gungahlin | +83.0% | $950,000 |
| 7 | Page | Belconnen | +81.5% | $988,000 |
| 8 | Chisholm | Tuggeranong | +81.3% | $927,000 |
| 9 | O'Malley | Woden | +79.9% | $2,634,000 |
| 10 | Dunlop | Belconnen | +79.8% | $933,000 |
Two things stand out. First, six of the top ten have a typical house price under $1 million. Over the long run, Canberra's more affordable family suburbs have kept pace with, and often beaten, the premium ones.
Second, Belconnen and Tuggeranong dominate the list. These are established suburbs with good-sized blocks, schools and steady owner-occupier demand, which tends to support prices through both strong and soft markets.
At the other end, Crace (+43.7%), Dickson (+47.1%) and Belconnen (+48.0%) grew the least over 10 years. Still solid growth, but well behind the typical Canberra suburb at about 70%.
Fastest growing Canberra suburbs over the last 5 years
Cook leads Canberra over the past five years with house prices up 31.4%, more than double the typical suburb's 14.1%. This period covers the post-COVID boom, the rate rises from 2022 and the market's recovery since.
| Rank | Suburb | District | 5 year growth | Typical house price |
|---|---|---|---|---|
| 1 | Cook | Belconnen | +31.4% | $1,203,000 |
| 2 | Belconnen | Belconnen | +30.2% | $697,000 |
| 3 | Aranda | Belconnen | +26.9% | $1,561,000 |
| 4 | O'Malley | Woden | +25.6% | $2,634,000 |
| 5 | Wright | Molonglo Valley | +25.1% | $1,305,000 |
| 6 | Red Hill | Inner South | +24.2% | $2,349,000 |
| 7 | Hackett | Inner North | +24.1% | $1,415,000 |
| 8 | Macarthur | Tuggeranong | +22.6% | $1,118,000 |
| 9 | Banks | Tuggeranong | +22.2% | $948,000 |
| 10 | Theodore | Tuggeranong | +22.0% | $938,000 |
One note on Belconnen itself: it's mostly a unit suburb, with only a couple of dozen house sales a year. A small number of sales can move the figure, so treat it with some caution.
The slowest suburbs over 5 years tell an interesting story. Lyons (-1.8%) and Chifley (-1.8%) have gone slightly backwards, while Downer (+0.7%), Ainslie (+0.9%) and Lyneham (+2.4%) have barely moved.
Lyons and Chifley are in Woden Valley; Downer, Ainslie and Lyneham are in the Inner North. One likely factor is that higher interest rates from 2022 squeezed buyers at higher price points. For buyers, that matters: a suburb that's been flat isn't necessarily a bad buy, and can sometimes be better value than one that's just had a big run.
Canberra suburbs with the strongest growth in the last 12 months
Tuggeranong has the most momentum right now. Four of the top ten suburbs for 12 month growth are in Tuggeranong, compared with a typical Canberra suburb at +3.4%.
| Rank | Suburb | District | 12 month growth | Typical house price |
|---|---|---|---|---|
| 1 | Denman Prospect | Molonglo Valley | +9.8% | $1,307,000 |
| 2 | Cook | Belconnen | +5.5% | $1,203,000 |
| 3 | Macarthur | Tuggeranong | +5.5% | $1,118,000 |
| 4 | Banks | Tuggeranong | +5.3% | $948,000 |
| 5 | Franklin | Gungahlin | +5.2% | $1,081,000 |
| 6 | Chisholm | Tuggeranong | +5.2% | $927,000 |
| 7 | Kambah | Tuggeranong | +5.1% | $973,000 |
| 8 | Dunlop | Belconnen | +5.1% | $933,000 |
| 9 | Aranda | Belconnen | +5.0% | $1,561,000 |
| 10 | Palmerston | Gungahlin | +5.0% | $1,003,000 |
Denman Prospect tops the list, but it's a newer estate in the Molonglo Valley. Some of that growth likely reflects the suburb maturing, as more completed homes sell, rather than like-for-like price rises.
The pattern underneath is clearer. Suburbs with houses priced around $900,000 to $1.1 million are where demand has been strongest. That's the price range many first home buyers and upgrading families can still borrow for, so competition there has stayed firm.
Only one suburb went backwards over the year: Crace, down 2.9%. Ainslie (+0.8%) and Lyons (+0.9%) were also near the bottom.
How each Canberra district compares
Tuggeranong is Canberra's strongest district for house price growth over 10 years and 12 months, and second only to the Inner South over 5 years, while also having the lowest typical house price.
| District | 10 year growth | 5 year growth | 12 month growth | Typical house price |
|---|---|---|---|---|
| Tuggeranong | +75.9% | +17.3% | +4.2% | $954,000 |
| Belconnen | +74.3% | +14.7% | +3.7% | $993,000 |
| Inner South | +69.9% | +18.0% | +3.9% | $2,317,000 |
| Weston Creek | +65.2% | +11.9% | +3.0% | $1,046,000 |
| Woden | +62.3% | +10.4% | +2.6% | $1,369,000 |
| Gungahlin | +61.1% | +13.1% | +3.5% | $1,003,000 |
| Inner North | +60.9% | +7.6% | +2.4% | $1,415,000 |
District figures are the median of suburbs with reliable house data in each district. Molonglo Valley is left out because only two suburbs have enough history.
For years, the inner north was seen as Canberra's safest bet. Over the last decade it's actually been the weakest district for house price growth, and it's been well behind over five years.
What this means if you're buying in Canberra
Past growth is useful, but it's only one input. Here's how I'd use this data if I were buying:
- Don't chase last year's winner. Suburbs that have just had a big run can be fully priced. Look at all three time frames together, not just the 12 month figure.
- Flat isn't always bad. Suburbs like Lyons and Chifley have gone sideways for five years. That can mean better value and less competition, as long as the fundamentals are still sound.
- Affordable doesn't mean second best. Some of Canberra's strongest long-term performers, like Holt, Banks and Chisholm, have typical house prices under $950,000.
- Check supply. Newer estates in Gungahlin and Molonglo have had a lot of new homes released, which can hold back growth. Established suburbs with no room to expand often hold value better.
- Look at the street, not just the suburb. Every suburb has good and bad pockets. Block size, aspect and what's planned nearby matter as much as the suburb average.
- Buy for your life first. If it's your home, commute, schools and lifestyle should lead the decision. Growth is the bonus, not the brief.
How this data was put together
All figures come from HtAG Analytics and show the cumulative change in the typical house price for each suburb, to 30 September 2026. Houses only; units are a different market and would need their own analysis.
To keep the rankings honest:
- Suburbs with limited sales are excluded. Suburbs with low data confidence or fewer than 20 house sales a year (such as Turner, Forrest, Kingston and Braddon) aren't ranked, because a few sales can swing their numbers.
- New estates are excluded from long-term rankings. Suburbs like Taylor, Strathnairn, Throsby, Moncrieff and Denman Prospect show 10 year growth of well over 100%. That's because early sales were often land or smaller homes, so the figure compares different products rather than real price growth.
- Typical price, not median. HtAG's typical price uses a model that smooths out unusual sales, which makes it more reliable than a simple median in small suburbs.
Past growth is not a guide to future performance. This article is general information only and isn't financial advice.
Frequently asked questions
Which Canberra suburb has had the highest capital growth?
Over the past 10 years, Holt has had the highest house price growth in Canberra, up 99% to a typical price of about $844,000. Over 5 years, Cook leads at +31.4%.
Which Canberra suburbs are growing fastest right now?
Over the 12 months to September 2026, Denman Prospect led at +9.8%, followed by Cook, Macarthur, Banks, Franklin and Chisholm, all around +5%. The typical Canberra suburb grew 3.4%.
How much have Canberra house prices grown in 10 years?
The typical Canberra suburb has seen house prices rise about 70% over the past 10 years, based on suburbs with reliable sales data.
Is Tuggeranong a good place to buy?
On growth alone, Tuggeranong has been one of Canberra's best performing districts, with the highest median growth over 10 years and 12 months and the lowest typical house price, at about $954,000. Whether it suits you depends on your budget, commute and what you need from a home.
Why have Woden Valley suburbs like Lyons and Chifley not grown?
Lyons and Chifley, both in Woden Valley, are down about 1.8% over 5 years. One likely reason is that higher interest rates since 2022 have weighed more on buyers at higher price points. Flat periods can create buying opportunities, but each property needs to be assessed on its own merits.
What's the cheapest Canberra suburb with strong growth?
Holt, Chisholm, Dunlop, Theodore and Banks all have typical house prices under $950,000 and rank in Canberra's top 10 for 10 year growth.
Where can I see growth for my suburb?
Search any suburb on the Canberra suburb growth map. You can switch between 10 years, 5 years and 12 months and see the typical house price.
Find the right suburb, then the right property
Suburb growth tells you where demand has been. It doesn't tell you which house to buy, what to pay, or whether a property has issues the agent isn't mentioning. That's where I come in.
I'm Thad, a Canberra buyers agent who works only for buyers, never sellers. I charge a fixed fee rather than a percentage, so there's no incentive for me to push you to spend more. And if you're not sure you're ready yet, that's fine too. Plenty of my clients start talking to me months before they buy.
- Explore the data: search your suburb on the Canberra suburb growth map
- See if you're ready: take the free Buyer Readiness Assessment
- Talk it through: book a free chat and we'll look at your shortlist together
Related reading: Canberra property market 2027 and the district guides for Tuggeranong, Belconnen, Gungahlin and the Inner North.